** Map of electricity use in Los Angeles http://sustainablecommunities.environment.ucla.edu/map/
** Europe’s energy dependency visualized http://energy.publicdata.eu/ee/index.html
** Vihreä pilvi / Nuage Vert http://www.vihreapilvi.org
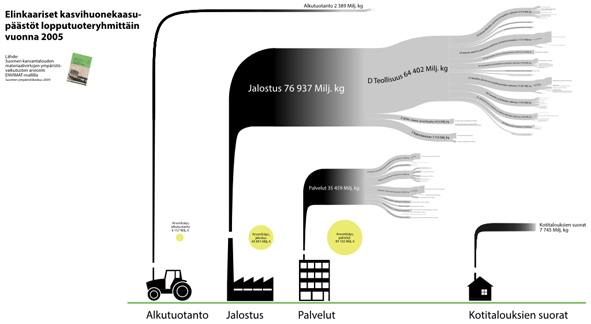
** Finland’s green house gas emissions visualized http://www.hahmota.com/envimat.html
** Sustainable Lifestyles 2050 http://spread.demoshelsinki.fi/singular_super_champions
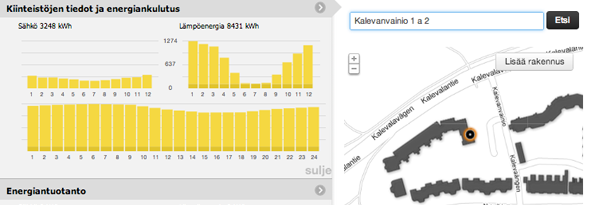
** Espoo City solar and geo energy map navigator http://energiatieto.wordpress.com
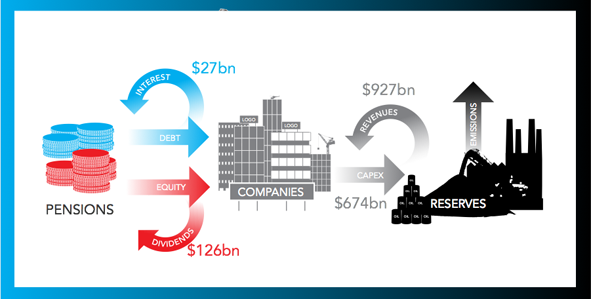
** Carbon Bubble Map http://www.guardian.co.uk/environment/interactive/2013/apr/19/countries-exposed-carbon-bubble-map
** Reegle Clean Energy Info Portal http://www.reegle.info
** OpenEI energy information wiki + Green Button apps http://en.openei.org/wiki/Main_Page
** Green Hackathon http://www.greenhackathon.com/category/hacks
MORE EXAMPLES OR RESOURCES?
Some great examples or resources missing from this list? Please add to the Etherpad page http://pad.okfn.org/p/energy-hackathon-2013-inspiration


